Case study 03 / 03 · Emergency response analytics
Nairobi Response
Emergency response analytics
Emergency-incident analytics for Nairobi's Fire & Rescue and disaster-risk teams.
Result
Response-time SLA visibility per sub-county, from raw logs to a live map and analytics in English and Swahili
01The problem
Why this needed building
Nairobi's fire brigade and disaster-risk teams generate detailed incident records — fires, building collapses, accidents — but the data lives in raw operational logs. Leadership had no spatial picture of where incidents concentrate, no view of response-time performance against SLA, and no self-serve way for analysts to slice the data.
The dashboard gives both teams their own lens on the same data: FRS (Fire & Rescue Services) gets an operations view — call-outs, response times, appliances dispatched — while DRR (Disaster Risk Reduction) gets impact analytics: casualties, causes, and affected sub-counties.
02My role
What I did
Sole engineer across the stack: a Next.js 14 frontend (this project) and a separate NestJS API deployed on Railway. Auth0 gates every route, with an ADMIN/FRR/DRR role model controlling access.
Next.js 14 (App Router) / TypeScript (strict) / MUI 7 / Apache ECharts / Leaflet + marker clustering / Auth0 / next-intl (EN/SW) / NestJS API on Railway
03Key decisions
Key technical decisions
- 01
A full-bleed incident map as the landing view
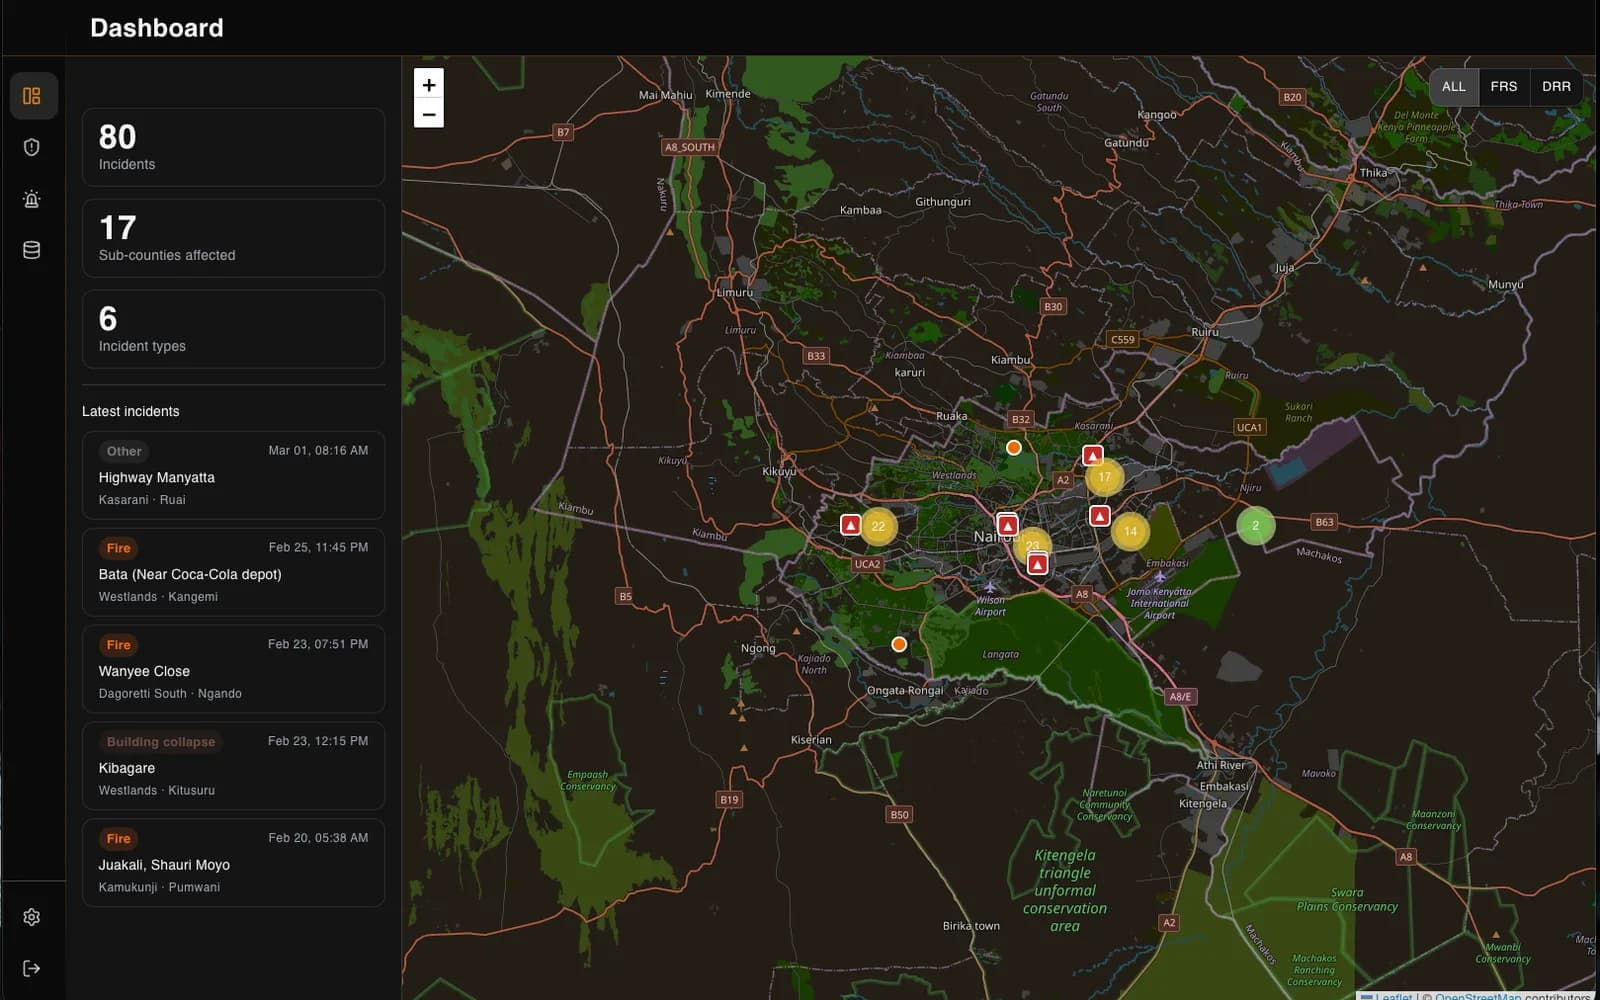
The dashboard opens on a clustered Leaflet map of the whole city — incidents color-coded by type, fire stations marked, popups on hover — beside a live summary panel. Dark mode CSS-inverts and hue-rotates the OpenStreetMap tiles for a native-feeling dark map without a paid tile provider.
- 02
Operations analytics that answer management questions
The FRS view alone has 8 ECharts panels — call-outs per day, response-time distribution, monthly trends, appliance dispatch breakdowns — headlined by a response-performance chart that splits every incident into within-SLA vs beyond-SLA per sub-county. That one chart turns raw logs into an accountability tool.
- 03
Every analysis is a shareable link
The data explorer encodes its entire view state — source, filters, period, sort — in the URL. An analyst who finds something can paste a link and a colleague opens the exact same view.
- 04
Bilingual by construction
English and Swahili via next-intl, with a build-gating script that fails CI if locale keys drift out of parity — translations can't silently go missing.
- 05
A real security posture
Auth0 sessions enforced in middleware on every route; API tokens live server-side only, with the browser going through route-handler proxies; a nonce-based Content-Security-Policy in production. Built like the government data it handles deserves.
05Outcomes
What it delivered
- Per-sub-county SLA visibility for fire-and-rescue response times — previously invisible in raw logs
- 14 charts across the FRS operations and DRR analytics views, plus a live incident map
- Fully bilingual (English / Swahili) with locale parity enforced at build time
- Role-based access (ADMIN / FRR / DRR) over an Auth0-gated NestJS API
- Shareable, URL-encoded analysis views with CSV export