Case study 02 / 03 · Waste collection operations
SmartBin
Waste Collection Operations
Live waste-collection operations for two cities — with zero backend.
Result
30–50% less collection distance across ~250 bins in two cities, with zero backend
01The problem
Why this needed building
City waste teams mostly collect on fixed schedules, blind to what's actually in the bins. The result is both kinds of waste at once: trucks visiting half-empty bins, and full bins overflowing between visits. IoT fill sensors solve the sensing half — but the data is only useful if dispatchers get a live operational picture and routes that react to it.
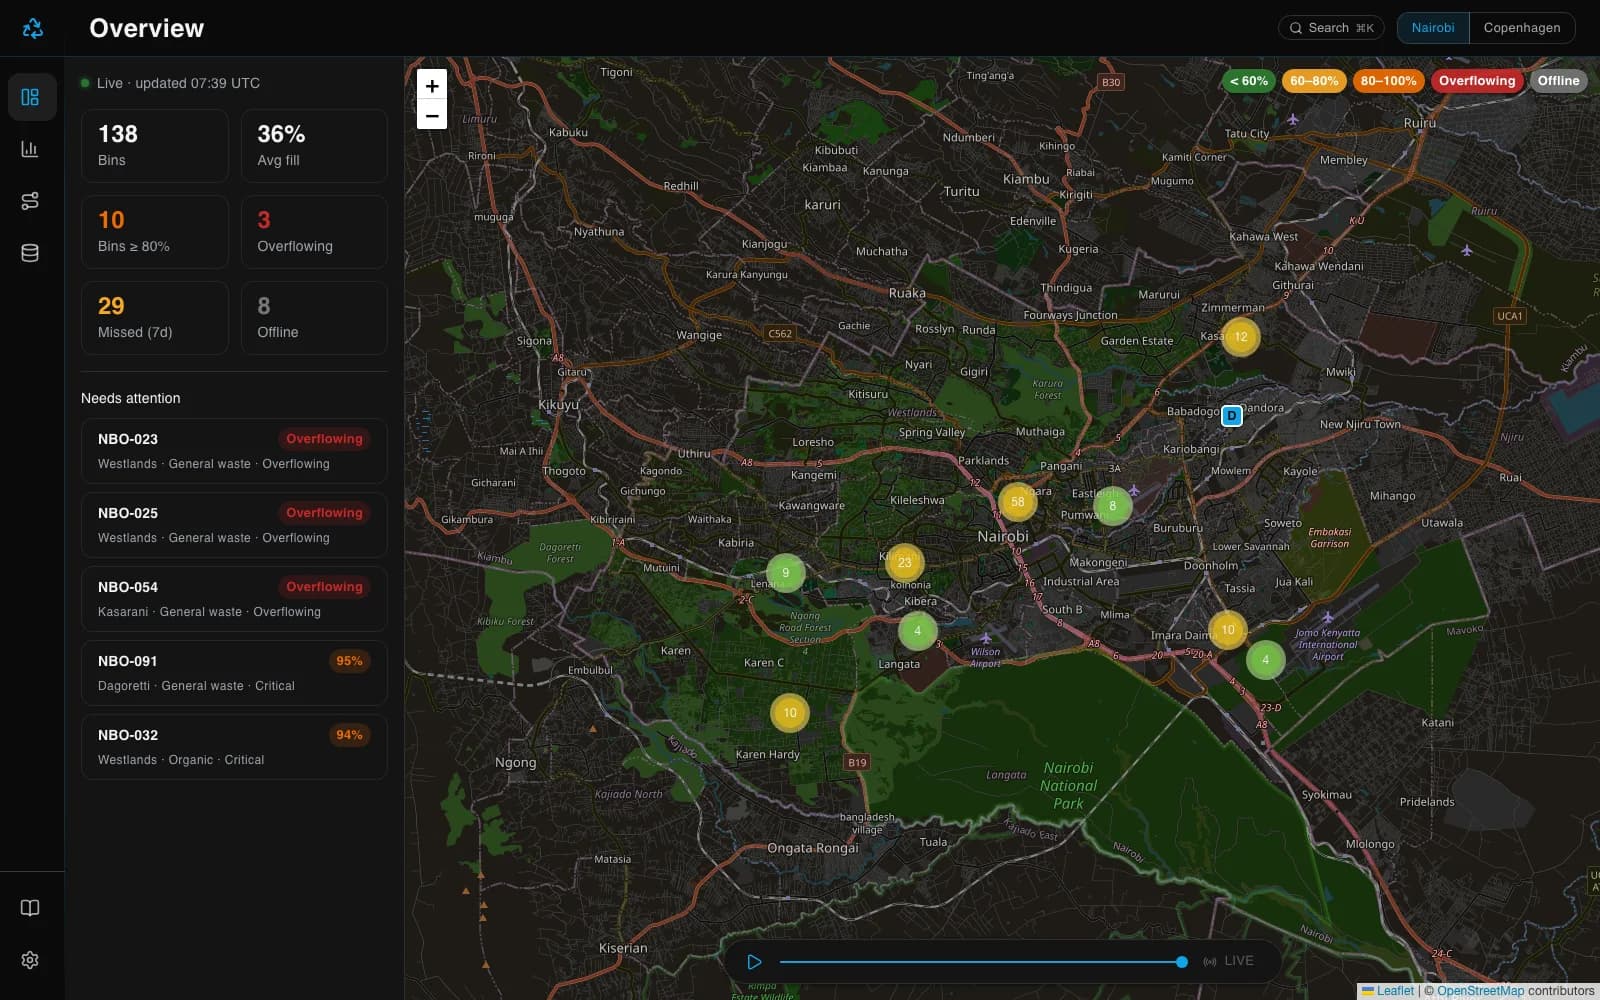
I built SmartBin to demonstrate what that operational layer looks like: live fill levels on a map, missed-pickup analytics, and optimized collection routes, for two cities with different geographies (Nairobi, ~140 bins across 10 districts; Copenhagen, ~110 bins across 8 districts).
02My role
What I did
Solo project — product design, data modelling, and the full build. The city is a URL segment, so /nairobi and /copenhagen are two complete, independently browsable deployments of the same system.
Next.js 14 (App Router) / TypeScript (strict) / MUI 7 / Apache ECharts / Leaflet + OpenStreetMap / MUI X DataGrid / Vitest
03Key decisions
Key technical decisions
- 01
A deterministic simulation instead of a backend
Every value in the app — fill levels, pickups, overflow events — is a pure function of the current time, computed by stateless hashing (hashRand(purpose, binId, dayIndex)). Server and client renders agree byte-for-byte, so SSR works without hydration mismatches, and two browsers opened side by side show identical live-ticking data. The payoff: a convincingly 'live' operational system with zero hosting cost, zero database, and perfectly reproducible states.
- 02
Route optimization that shows its work
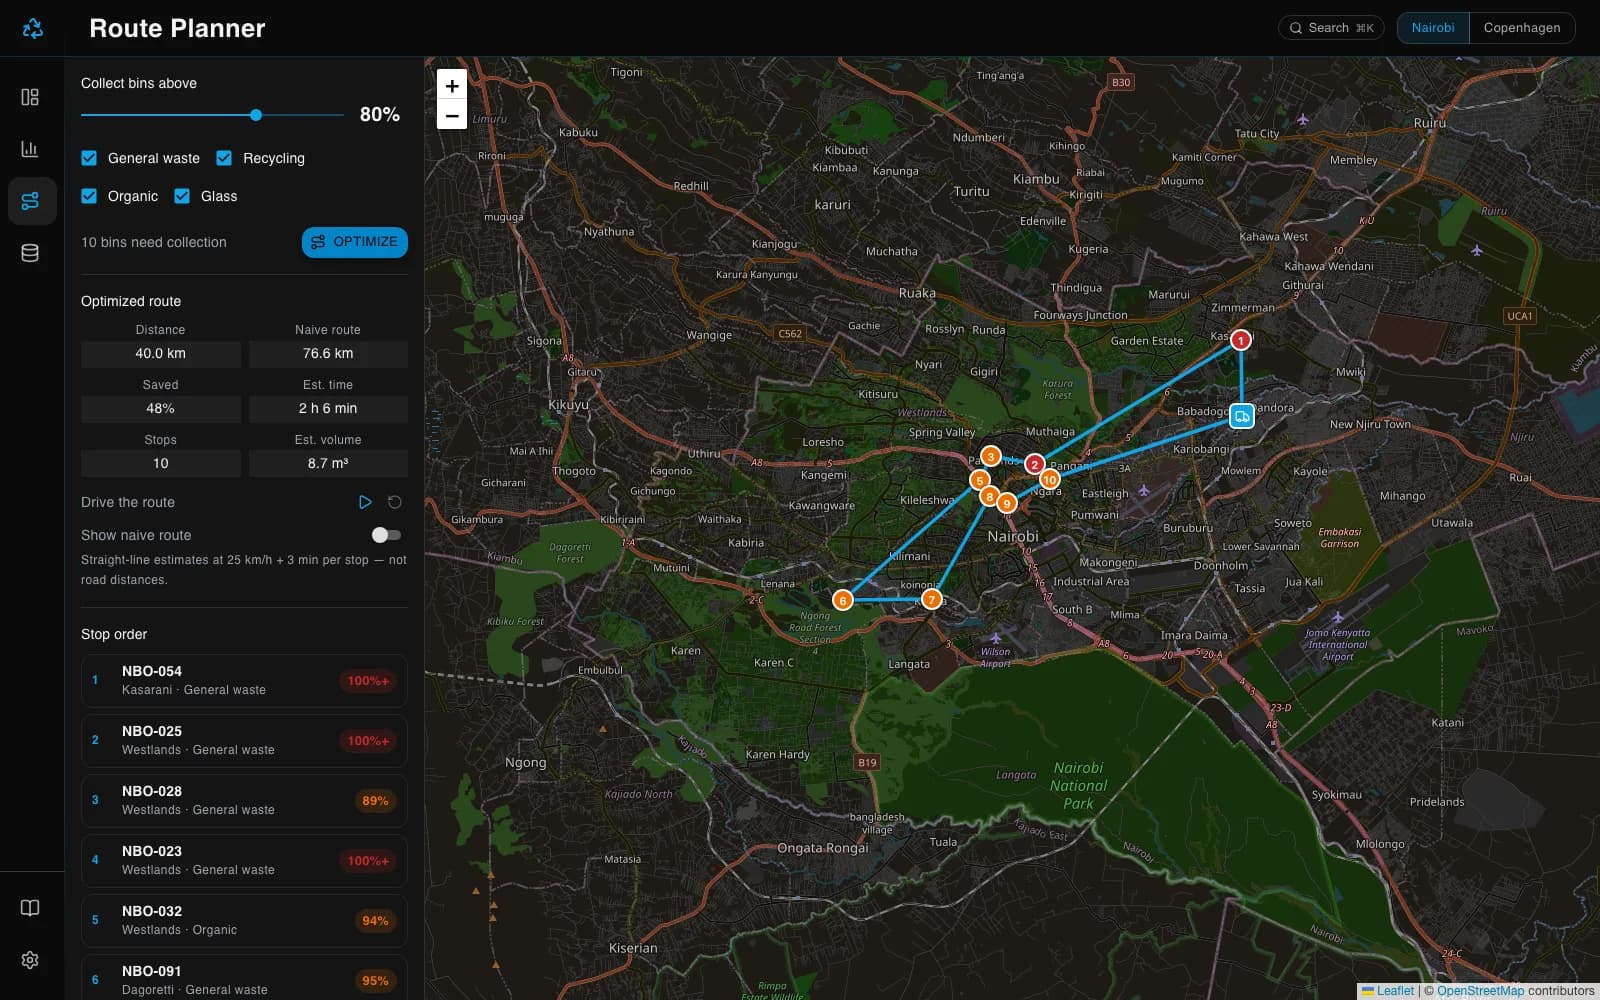
The route planner builds a collection route from the city depot with nearest-neighbour construction, then improves it with 2-opt local search. The UI draws the optimized route against the naive bin-order route on the map, with the distance saving quantified — typically 30–50% shorter.
- 03
The map as the operational home
A Leaflet map with marker clustering is the landing view: every bin colored by fill band, KPIs ticking every 30 seconds, so a dispatcher's first glance answers 'where is it getting critical?'
- 04
Shareable state everywhere
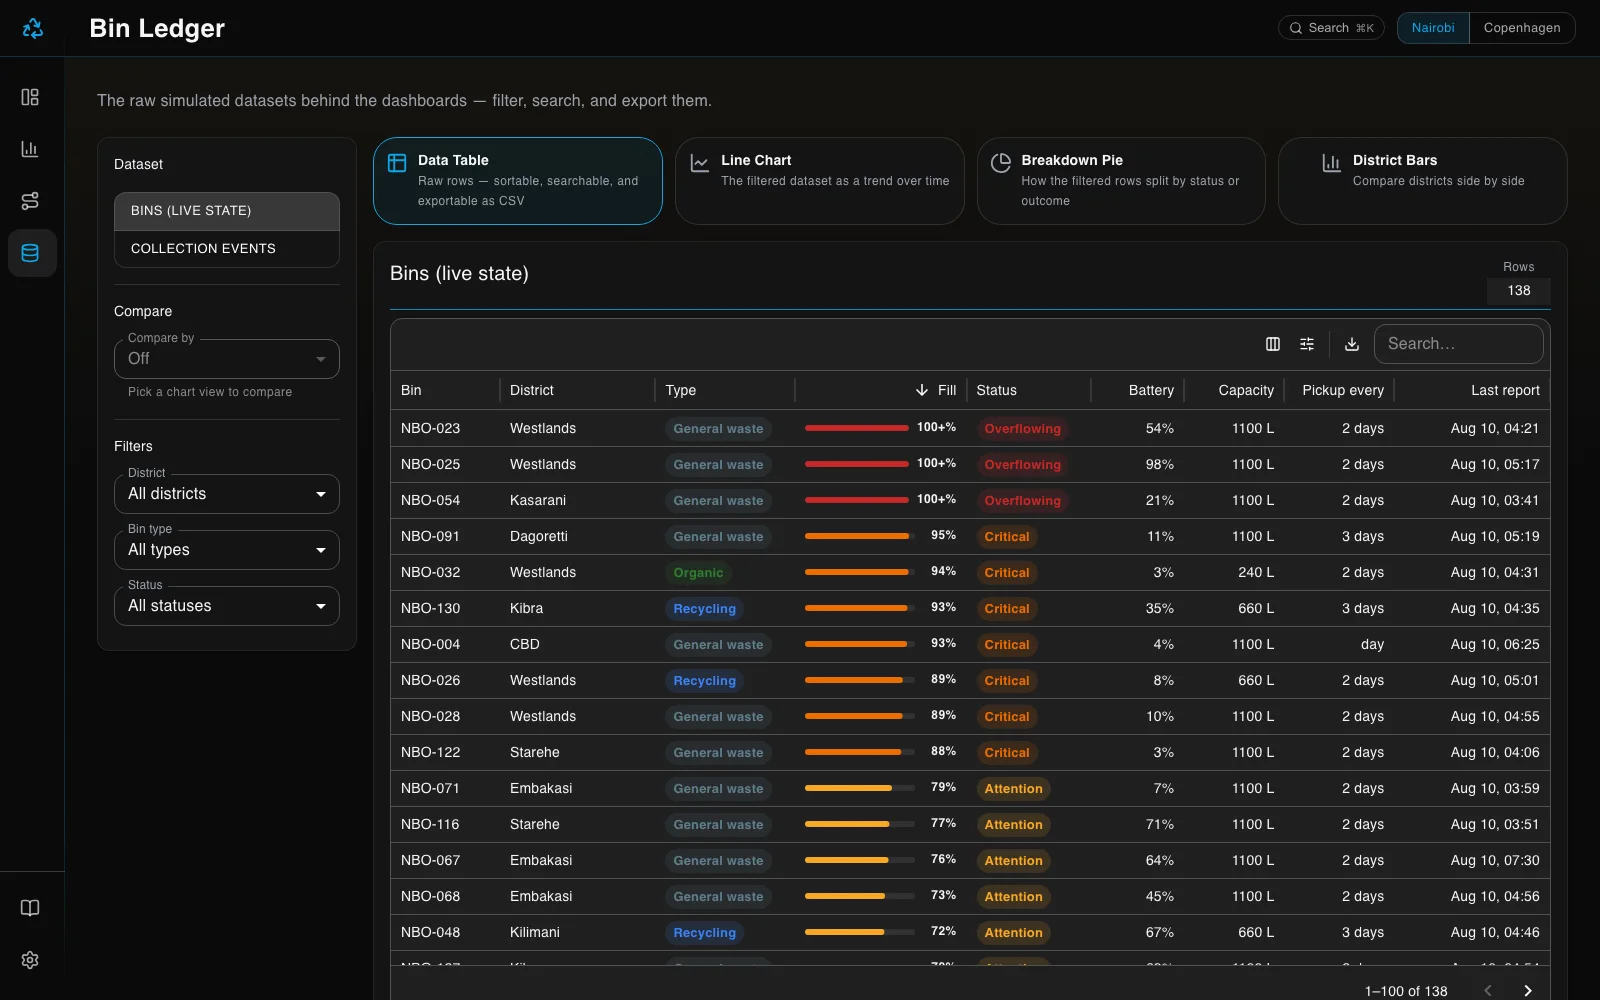
The bin ledger's full view state — filters, sort, search, pagination — is URL-encoded, so any filtered view is a link a colleague can open identically. Grids export to CSV for the spreadsheet crowd.
- 05
Polish that survives a hard refresh
Dark/light theme is cookie-persisted and applied server-side, so there is no flash of the wrong theme on first paint. Design tokens are centralized and typed, flowing through the MUI theme.
04In the app
In the app
05Outcomes
What it delivered
- ~250 simulated IoT bins across 2 cities, live-ticking and identical for every visitor
- 30–50% route-distance savings vs naive bin ordering (nearest-neighbour + 2-opt)
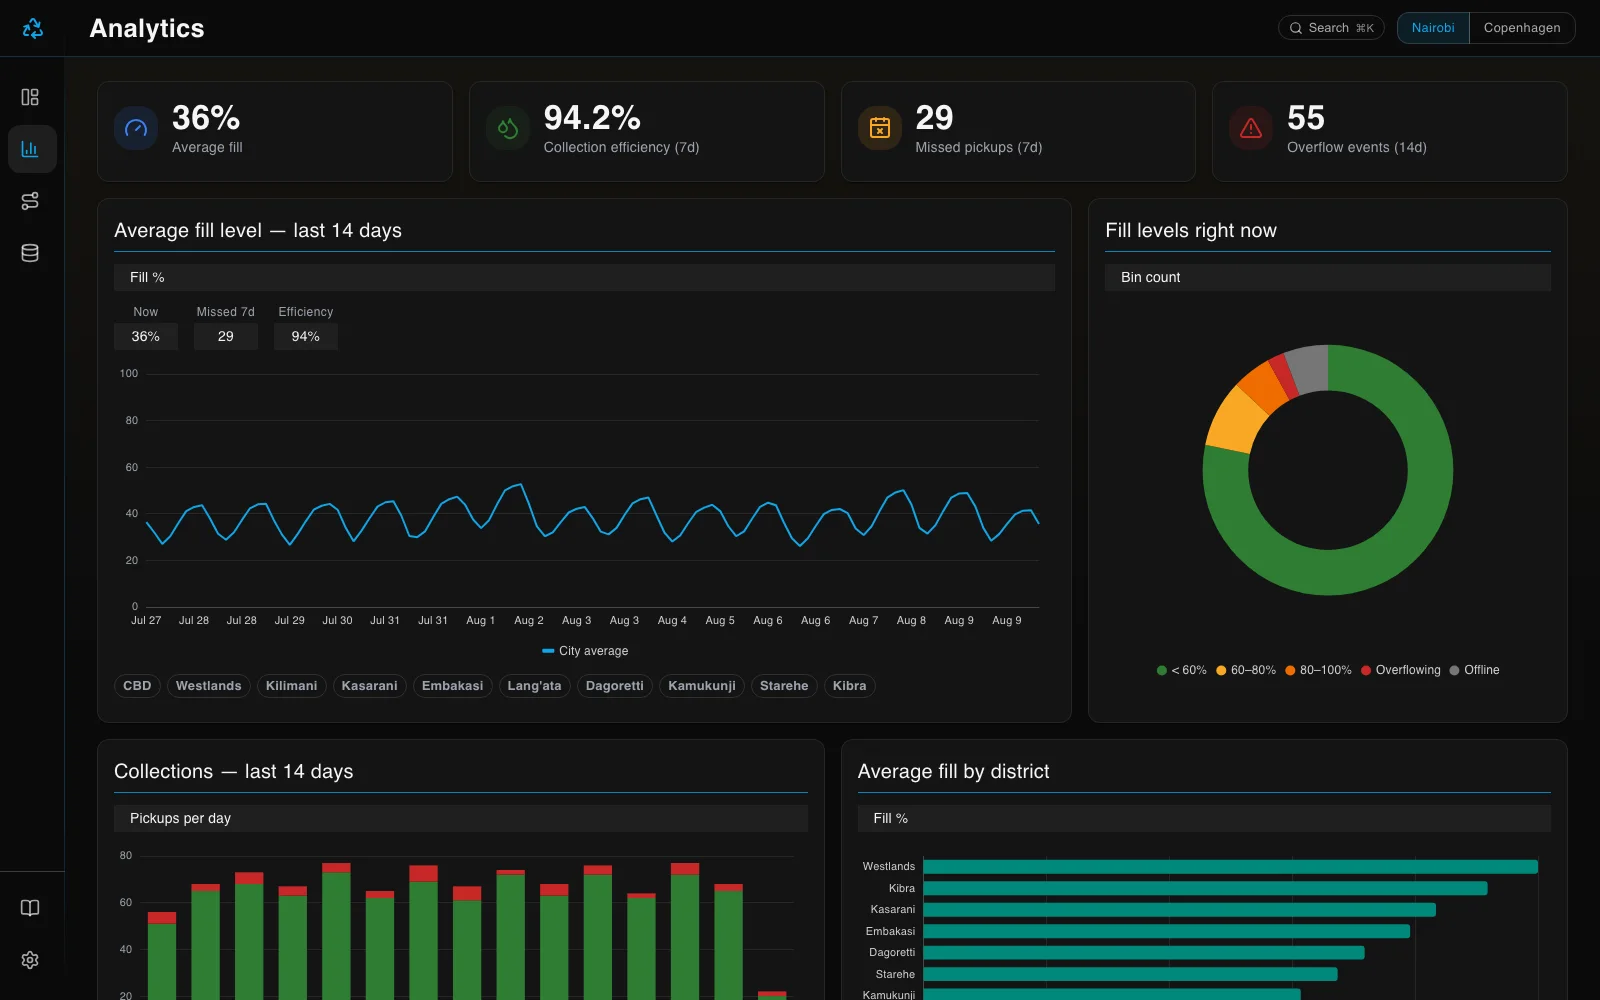
- 4 views: live map overview, 14-day analytics, route planner, exportable bin ledger
- 35 Vitest unit tests covering the simulation, routing, and KPI logic
- Zero backend: deploys as a static-friendly Next.js app with no infrastructure cost